S&P 500 vs Nasdaq: Better for Long-Term Investors 2026?
The Nasdaq-100 is beating the S&P 500 in 2026, just like it did before the 2022 crash hit it twice as hard. Here's the honest, timeline-based breakdown.
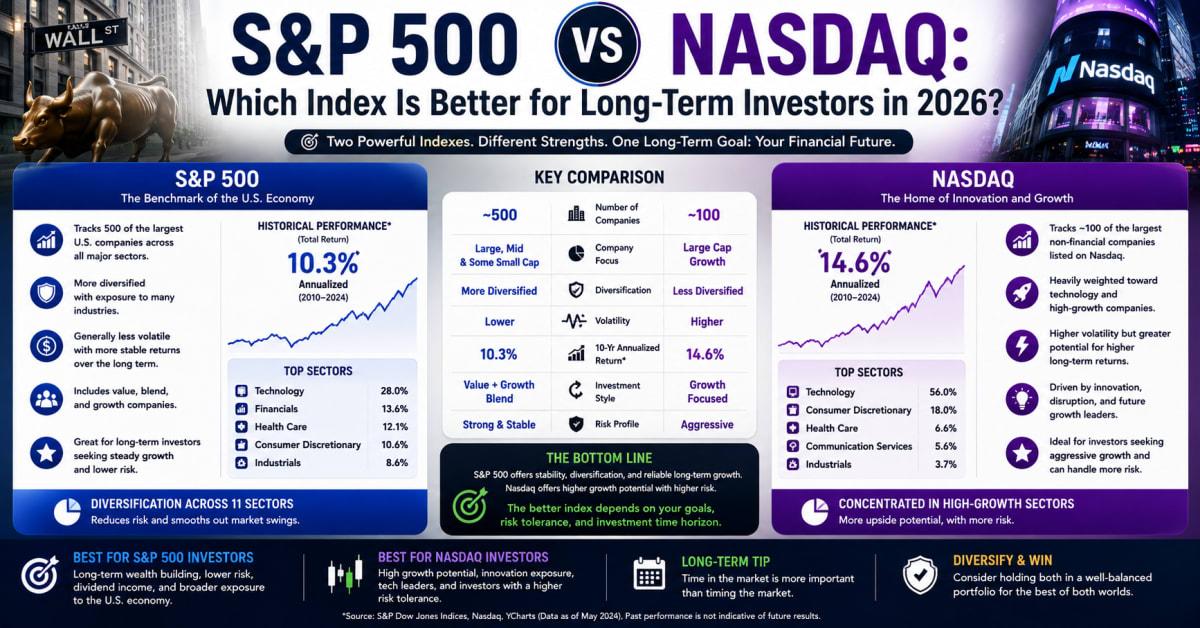
S&P 500 vs Nasdaq: Better for Long-Term Investors 2026?
The Nasdaq-100 is up 17.5% so far in 2026. The S&P 500 is up 10%. That gap looks like a clear win for Nasdaq investors, until you remember that in 2022, the Nasdaq-100 fell about 30% while the S&P 500 dropped roughly 18%. Same index, same pattern, opposite direction.
S&P 500 versus Nasdaq isn't really a question of which one performs better. It's a question of which one matches your actual timeline and stomach for volatility. This guide breaks down what each index actually holds, walks through a real case study comparing two investor profiles, and includes a calculator so you can model both paths with your own numbers.
S&P 500 vs Nasdaq — What Each Index Actually Holds
The S&P 500 tracks roughly 500 of the largest U.S. companies across every major sector, financials, healthcare, energy, industrials, and technology combined. The Nasdaq-100 tracks the 100 largest non-financial companies listed on the Nasdaq exchange, which skews heavily toward technology and growth-oriented businesses, including many of the same mega-cap names that also appear in the S&P 500.
This distinction matters because the Nasdaq-100 isn't really a competing "everything" index. It's a concentrated bet on a specific slice of the market, technology and growth, while the S&P 500 spreads risk across the entire U.S. economy.
Why This Is Important Right Now
Picture an investor who chased the Nasdaq-100's stronger recent returns without fully internalizing that the same concentration driving those gains also drove a steeper, faster decline in 2022. That investor's actual experience depends entirely on when they needed the money, not just the index's long-term average.
The Shiller CAPE ratio, a measure of stock valuations relative to long-term historical earnings, hasn't been this high since the dot-com bubble, according to recent analysis. That context matters for anyone deciding how much of a concentrated, growth-heavy index to hold right now versus a broader, more diversified one.
2026 Year-to-Date vs the 2022 Downturn
This is the core tension in one visual: the same index that's winning in 2026 lost far more in the last major downturn.
2026 Year-to-Date Return
2022 Downturn
2026 YTD as of early July 2026, per Motley Fool analysis. 2022 figures represent full-year approximate drawdowns. Past performance doesn't predict future results.
Key Facts About S&P 500 vs Nasdaq in 2026
A few core facts explain the actual tradeoff between these two indexes, beyond whichever one happens to be winning this particular year.
- The Nasdaq-100 has significantly outpaced the S&P 500 since 2007 on a cumulative basis — with the Nasdaq-100 Total Return Index surging over 1,000% since December 2007, more than double the S&P 500's total return over the same period.
- Both indexes have posted double-digit returns in 2023, 2024, and 2025 — reflecting a strong multi-year bull run for U.S. stocks broadly, not just tech.
- The Nasdaq-100 fell roughly 30% in 2022, compared to about 18% for the S&P 500 — illustrating the steeper downside that comes with its more concentrated, tech-heavy composition.
- Many analysts recommend the Nasdaq-100 as a supplement, not a replacement — commonly suggesting 10% to 30% of a portfolio, layered on top of a core S&P 500 holding rather than instead of it.
- The Nasdaq-100 automatically rotates in the largest, most promising growth companies — giving long-term holders continuous exposure to leading non-financial businesses without needing to pick individual stocks.
What the Industry Data Shows
Industry data suggests that current bull market strength has real fundamental support, with earnings growth remaining strong and forecast to continue over the next several quarters, rather than being driven by pure speculation alone.
Analysts covering both indexes consistently frame the decision around two factors: risk tolerance and time horizon. Investors with fewer than five years until they need the money are generally steered toward the S&P 500's broader diversification, while those with longer timelines are more often pointed toward accepting the Nasdaq-100's higher volatility for its stronger historical upside.
Case Study: Two Investors, Same Year, Different Outcomes
Here's how two investors with identical $20,000 starting balances might experience these two indexes very differently, depending on their timeline.
Investor A: Elena, 28, investing for retirement 35 years out. Elena puts her full $20,000 into a Nasdaq-100 tracking ETF. In a strong year like 2026, her balance grows faster than a comparable S&P 500 investment would. She's aware that a year like 2022 could cut her balance by nearly a third, but with decades before she needs the money, she has time to recover and keeps contributing through the downturn rather than selling.
Investor B: Marcus, 59, retiring in four years. Marcus keeps his $20,000 in a broad S&P 500 index fund instead. He accepts a somewhat lower expected return in exchange for meaningfully less downside risk, since a 30% drop with only four years left before retirement would be far harder to recover from than the same drop would be for Elena.
Both investors are making a reasonable choice for their specific situation. Neither index is objectively "better." The right one depends on how many years stand between now and when the money actually gets spent.
Step-by-Step: How to Decide Your Allocation
Use this sequence to figure out a reasonable split between the two, rather than going all-in on whichever index had the better headline this year.
Step 1: Count your actual years until you need the money. Under 5 years leans toward the S&P 500's stability. 15 years or more allows more room for the Nasdaq-100's volatility.
Step 2: Stress-test your reaction to a 30% drop. If a Nasdaq-100-level decline would genuinely make you panic-sell, that's a real signal to keep your allocation lower regardless of your timeline.
Step 3: Start with the S&P 500 as your core holding. Most guidance treats the S&P 500 as the default foundation of a long-term portfolio, not the Nasdaq-100.
Step 4: Layer in a Nasdaq-100 allocation deliberately. A commonly cited range is 10% to 30% of your total equity allocation, rather than an even split or full concentration.
Step 5: Revisit the split as your timeline shortens. Reducing your Nasdaq-100 percentage gradually as you approach your goal mirrors how Marcus's allocation should look different from Elena's.
Calculate Your Own Blended Portfolio Projection
Model how a blend of S&P 500 and Nasdaq-100 exposure might grow over your specific timeline. This is a simplified illustration, not a return guarantee.
Benefits and Real Opportunities
Each index offers genuine, distinct advantages depending on your specific goals and timeline.
- S&P 500 offers broad, built-in diversification — spreading risk across every major sector so one industry's downturn doesn't sink your entire portfolio.
- Nasdaq-100 offers concentrated exposure to leading growth companies — automatically rotating in the largest, most promising non-financial businesses without requiring individual stock selection.
- Both are available through low-cost, highly liquid ETFs — SPY or VOO for the S&P 500, and QQQ for the Nasdaq-100, making either easy to buy and hold long term.
- Blending both captures complementary strengths — stability from broad diversification alongside stronger historical upside from concentrated growth exposure.
Costs and What to Expect
ETFs tracking both indexes carry low expense ratios, with S&P 500 funds like VOO commonly charging around 0.03% annually and Nasdaq-100 funds like QQQ typically charging a modest amount more, often around 0.20%, reflecting the more specialized index construction. Both trade commission-free at most major brokers.
The real cost difference isn't in fees, it's in volatility experienced. A Nasdaq-100-heavy portfolio can see sharper drawdowns during a downturn, which carries a genuine behavioral cost if that volatility leads to panic-selling at the worst possible time, as illustrated in Marcus's case above.
Both indexes generate capital gains tax when sold at a profit in a taxable account, taxed based on how long you've held the position, not which index you chose.
S&P 500 Only vs Nasdaq-100 Only vs a Blended Allocation: Which One Is Right for You?
| Option | Best For | Pros | Cons |
|---|---|---|---|
| S&P 500 Only | Investors near retirement or prioritizing stability | Broad diversification and historically softer drawdowns | Historically lower long-term returns than a concentrated growth index |
| Nasdaq-100 Only | Younger investors with a long timeline and high risk tolerance | Strongest historical long-term cumulative returns of the two | Significantly steeper drawdowns during downturns, as seen in 2022 |
| Blended Allocation (10-30% Nasdaq-100) | Most long-term investors seeking a balanced approach | Captures growth upside while keeping a diversified, stable core | Requires managing and periodically rebalancing two positions |
Who Should Actually Care About This Comparison?
This matters for anyone building a long-term index fund portfolio and deciding how much, if any, concentrated tech and growth exposure to add on top of a core holding. It's especially relevant for younger investors with decades until retirement weighing extra Nasdaq-100 exposure, and for those approaching retirement who need to honestly assess how much volatility their timeline can actually absorb.
Mistakes Most People Make
A handful of habits lead investors to a mismatched allocation between these two indexes.
Chasing whichever index had the better return this specific year, rather than looking at the full cycle including downturns, leads to buying high after a strong run and potentially panic-selling after the next inevitable pullback.
Going all-in on the Nasdaq-100 for its stronger historical returns without honestly stress-testing your reaction to a 30% drawdown, like the one in 2022, can lead to exactly the panic-selling behavior that erases those long-term gains.
Treating the S&P 500 as entirely tech-free diversification overlooks that both indexes already share significant overlap in mega-cap technology holdings, so the real diversification benefit is more modest than many assume.
Setting a Nasdaq-100 allocation once and never revisiting it ignores that the right split, as Marcus's case illustrates, should generally shrink as your timeline shortens and your need for stability increases.
What Most Articles Won't Tell You
Most comparisons lead with whichever index is currently winning, but the far more useful comparison is how each index behaved during its worst recent year, not its best. The 2022 downturn tells you more about your realistic downside than 2026's year-to-date numbers do.
There's also a detail worth knowing: because the Nasdaq-100 excludes financial companies entirely, it isn't purely a "tech index" in the way headlines often suggest, though its heavy technology weighting still drives most of its performance characteristics in either direction.
Advanced Moves Worth Knowing
Rebalancing your S&P 500 and Nasdaq-100 allocation annually, rather than letting a strong Nasdaq-100 year silently grow your risk exposure unchecked, keeps your actual portfolio aligned with your intended split over time.
Gradually reducing your Nasdaq-100 percentage as you approach your goal, following the same logic that separates Elena's and Marcus's appropriate allocations, protects gains without requiring you to guess a market top.
Frequently Asked Questions
Is the Nasdaq-100 riskier than the S&P 500?
Yes, generally. Its concentration in technology and growth companies means it typically experiences sharper gains in strong years and steeper losses in downturns, as shown by the roughly 30% drop in 2022 compared to the S&P 500's 18% decline.
Should I invest in the S&P 500, the Nasdaq-100, or both?
Many long-term investors hold both, using the S&P 500 as a diversified core holding and adding a smaller Nasdaq-100 allocation, commonly 10% to 30%, for additional growth exposure.
Does the Nasdaq-100 include financial companies?
No, the Nasdaq-100 specifically excludes financial companies, focusing instead on the largest non-financial businesses listed on the Nasdaq exchange, which skews heavily toward technology and growth sectors.
How much of my portfolio should be in the Nasdaq-100?
There's no universal number, but many analysts commonly suggest 10% to 30% of your equity allocation, layered on top of a core S&P 500 holding rather than as a full replacement for it.
Which index is better for someone near retirement?
The S&P 500 is generally considered the safer choice for investors with fewer than five years until retirement, given its broader diversification and historically softer drawdowns compared to the more concentrated Nasdaq-100.
The Bottom Line on S&P 500 vs Nasdaq in 2026
Neither the S&P 500 nor the Nasdaq-100 is objectively better in 2026. The Nasdaq-100 has delivered stronger returns both this year and over the long run, but it also falls significantly harder during downturns, exactly the tradeoff that separated Elena's and Marcus's appropriate strategies in the case study above. Use the calculator to model your own timeline and allocation, be honest about how you'd actually react to a 30% drop, and consider a blended approach rather than betting everything on whichever index happens to be winning this particular year.
Read Next

How to Start Investing in Index Funds in 2026: A Beginner's Guide

Value Investing in 2026: A Beginner's Roadmap

How to Invest in Growth Stocks for 2026

Smart Passive Income Strategies for 2026

How to Start Retirement Investing in 2026: A Step-by-Step Guide